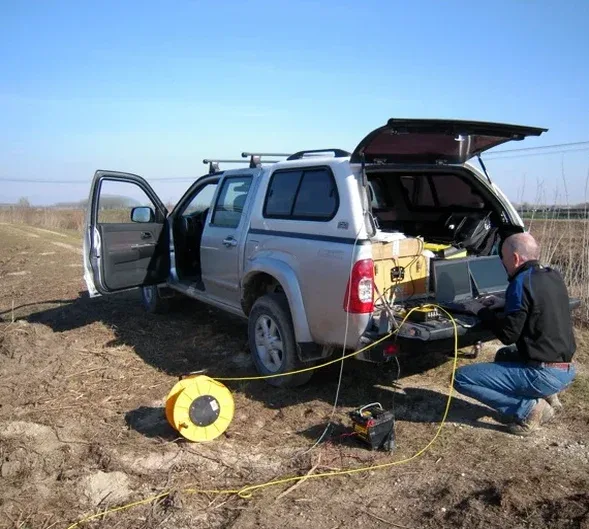
A common mistake we see on Moreno Valley sites is assuming that a few shallow borings are enough to characterize the entire subsurface, only to hit unexpected boulders or a steep bedrock drop-off halfway through excavation. The city sits on the eastern edge of the Perris Block, where the crystalline basement can rise abruptly beneath alluvial fan deposits from the San Jacinto and Box Springs mountains, and standard drilling alone often misses these lateral changes. Seismic tomography fills that gap by imaging the ground continuously between control points, giving us velocity cross-sections that reveal rippability limits, weathered zones, and hidden step faults before the backhoe ever breaks ground. When we combine the seismic profile with targeted SPT drilling at key anomalies, the geotechnical model tightens up fast and the contractor knows exactly where refusal will happen.
A velocity jump from 3,000 to 8,000 ft/s in a refraction tomogram tells the excavation contractor more about the day's production than any borehole log ever could.
Our approach and scope
The IBC 2021 and ASCE 7-22 require site class determination based on shear-wave velocity averaged over the upper 30 meters, and in Moreno Valley that classification can shift dramatically across a single parcel because of the thin sedimentary cover over granitic basement. Our refraction and reflection surveys use 24- and 48-channel seismographs with vertical geophones spaced at 5 to 10 feet, generating P-waves with a 12-pound sledgehammer or an accelerated weight drop depending on penetration depth needed. We process the first-arrival picks through tomographic inversion — typically with a damped least-squares algorithm — to produce a 2D velocity model that distinguishes compacted alluvium from decomposed granite and fresh rock. For reflection profiling we deploy a common-midpoint geometry with higher fold coverage when the target is a deeper basin structure or a suspected fault strand, extracting stacked sections after normal moveout correction and bandpass filtering. The final deliverables include velocity contour maps, interpreted geologic cross-sections, and a rippability chart tied directly to Caterpillar D9/D10 performance curves referenced in the Caltrans Standard Specifications.
Local ground factors
Moreno Valley's build-out accelerated after the 1980s incorporation, pushing residential subdivisions and warehouse logistics centers into the foothill transition zones where alluvial fans thin out over weathered granite. What makes this risky from a geotechnical standpoint is that the contact between soil and rock is rarely flat — it channels along paleo-drainages and can drop 20 feet over a 50-foot horizontal distance. A foundation design that assumes uniform bearing on dense alluvium can end up partially bearing on rock with a completely different settlement response, inducing differential movement that cracks slabs and tilts tilt-up panels. Seismic tomography catches those buried ridges and troughs before grading begins, because the velocity contrast between a saturated sandy layer and the underlying granodiorite is stark and unambiguous on the tomogram. Without this imaging, the contractor is essentially grading blind, and the cost of unforeseen rock excavation in Riverside County can eat a contingency budget in a single week.
Common questions
How much does a seismic refraction survey cost for a typical Moreno Valley warehouse pad?
For a standard commercial lot of 2 to 5 acres, a refraction survey with two to three spread lines and tomographic processing runs between US$3,000 and US$5,520. The final number depends on line length, geophone spacing, and whether we need a weight drop source for deeper penetration or can work with sledgehammer energy.
What is the difference between refraction and reflection tomography for our project?
Refraction tomography images velocity gradients and is best for mapping the soil-to-rock transition, rippability, and the upper 100 feet. Reflection imaging captures impedance contrasts at layer boundaries and works better for deeper targets, fault geometry, and basin structure. On most Moreno Valley sites we start with refraction and add reflection lines only if there is a specific need to trace a fault or map a deep basin.
How do you handle ambient noise from nearby highways like the 60 or 215 during data acquisition?
We stack multiple hammer blows per shot point — typically 5 to 10 stacks — and apply a bandpass filter in the field to suppress traffic rumble below 20 Hz. Our seismographs record in continuous mode so we can visually inspect each shot gather and reject any trace contaminated by a passing truck before picking first arrivals.